
Trading isn’t just about luck — it’s about reading the market’s pulse. Technical indicators help traders make smarter, data-driven decisions by analyzing price trends, volume, and momentum. Whether you’re a beginner or a seasoned trader, here are five must-know technical indicators that can level up your trading game.
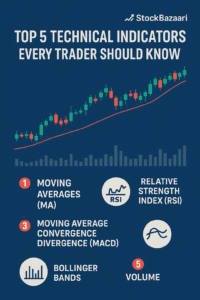
1️⃣ Moving Averages (MA)
Moving Averages smooth out price data to identify the direction of a trend.
-
Simple Moving Average (SMA): Best for spotting long-term trends.
-
Exponential Moving Average (EMA): Reacts faster to recent price changes — great for short-term trades.
💡 Tip: Watch for the crossover of 50-day and 200-day MAs for potential trend reversals.
2️⃣ Relative Strength Index (RSI)
RSI measures market momentum — showing if a stock is overbought (>70) or oversold (<30).
When RSI moves from overbought to neutral, it may signal a potential fall — and vice versa.
💡 Use RSI with support/resistance zones for more accuracy.
3️⃣ Moving Average Convergence Divergence (MACD)
MACD shows the relationship between two moving averages.
When the MACD line crosses above the signal line, it indicates bullish momentum; a cross below means bearish pressure.
💡 Combine MACD with volume analysis to confirm the strength of the move.
4️⃣ Bollinger Bands
Bollinger Bands consist of a moving average and two standard deviation lines.
When prices touch the upper band, the market may be overbought; the lower band often signals oversold conditions.
💡 Wider bands = higher volatility. Narrow bands = potential breakout ahead.
5️⃣ Volume
Volume is the heartbeat of the market. It confirms price moves — a breakout with high volume is more reliable than one with low volume.
💡 Always look for volume confirmation before entering trades.
✅ Final Thoughts
Technical indicators are powerful tools — but no indicator works in isolation. Combine them, use proper risk management, and most importantly, stay disciplined.
🚀 Start analyzing charts today, and let data guide your next profitable trade!
Frequently Asked Questions (FAQs)
Is Technical Analysis Reliable?
Technical analysis attempts to gauge market sentiment using graph patterns and signals. The range of success for different indicators varies. Hence, it’s best to use a suite of technical tools and indicators with other techniques like fundamental analysis to improve reliability.
Which Technical Indicator Can Best Spot Overbought/Oversold Conditions?
The relative strength index (RSI) is among the most popular technical indicators for identifying overbought and oversold stocks. The RSI is bound from 0 to 100. Traditionally, a reading above 70 indicates overbought, and below 30, oversold.
How Many Technical Analysis Tools Are There?
There are several dozen technical analysis tools, including a range of indicators and chart patterns. Market technicians are always creating new tools and refining old ones.